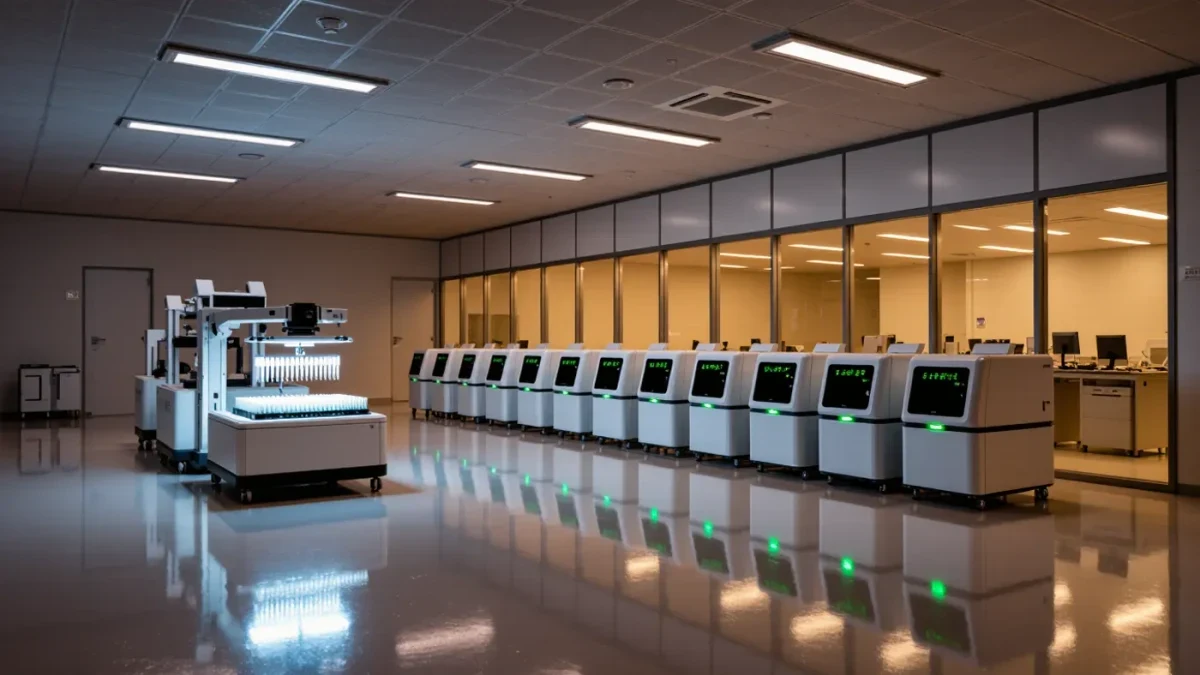
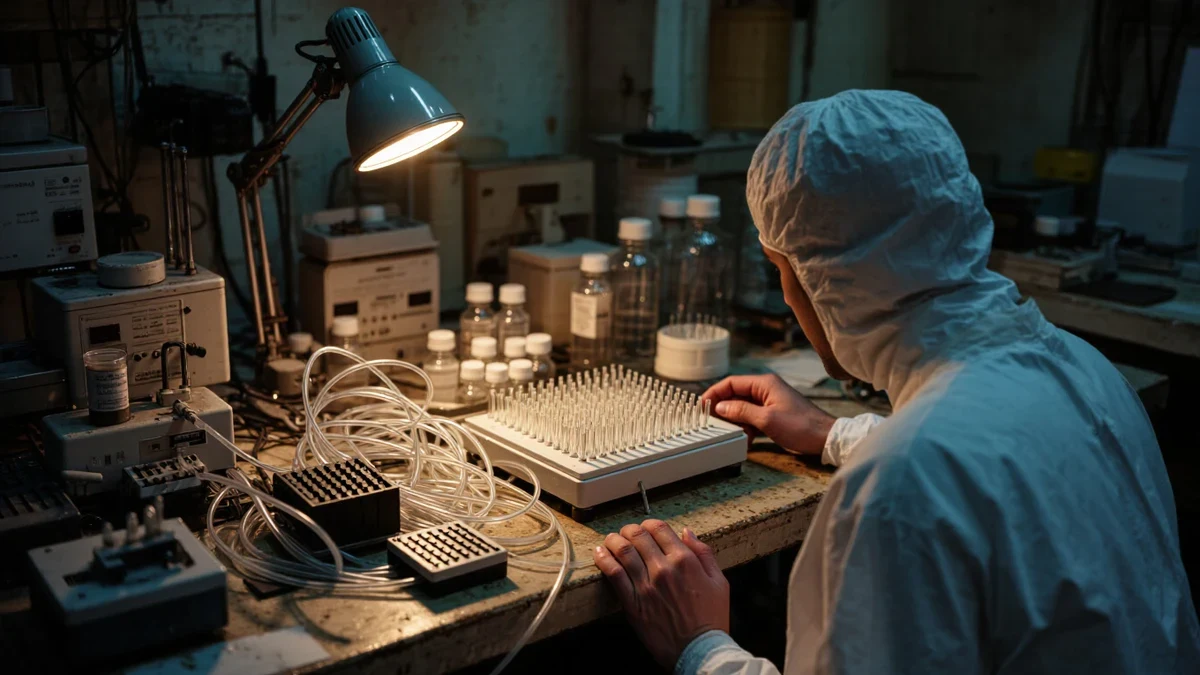
Omics technologies are measurement methods that read entire classes of molecules at once — genes, RNAs, proteins, metabolites — and single-cell resolution is their current frontier, profiling one cell's transcriptome at a time so tissues resolve into their working parts. The scale is now atlas-level: more than 40 papers in a November 2024 Nature collection map the effort.
What does each omics layer actually measure?
Each layer answers a different question about the same tissue. Genomics reads the blueprint and its variation; transcriptomics — the layer behind single-cell atlases — counts which genes a cell is actively reading; proteomics and metabolites measure the machinery and its output. Single-cell sequencing changed transcriptomics from averaged soup to census: instead of a bulk signal blending thousands of cells, each cell gets its own expression profile, letting rare populations — a disease-driving fibroblast subset, an exhausted T-cell state — appear at all. The method's honest limits are dissociation artifacts, batch effects between studies, and the fact that a snapshot profile is not a lineage or a mechanism.
How did atlas-scale references change the field?
Coordinated programs turned scattered datasets into a common coordinate system. Established in 2016, the Human Cell Atlas consortium "set out to create a comprehensive biological map of cells within the human body" and is now "working towards assembling the first draft of this atlas, focusing on 18 biological network atlases," per the consortium's Nature collection of more than 40 papers published November 20, 2024. The consequence is comparability: a cell state found in one lab's disease cohort can be placed against profiles from many tissues, donors, and studies, which is what turns an observation into evidence about whether a state is disease-specific or simply rare.
What do foundation models add on top of atlases?
Search at scale. A 2024 Nature paper describes SCimilarity, "a metric-learning framework to learn a unified and interpretable representation that enables rapid queries of tens of millions of cell profiles from diverse studies," applied to a 23.4-million-cell atlas of 412 single-cell RNA-sequencing studies to retrieve macrophage and fibroblast profiles from interstitial lung disease and surface similar profiles in other fibrotic diseases, per the paper. The paper also reports an experimental step that matters more than the benchmark: the top in vitro hit for the macrophage query — a 3D hydrogel system — was tested and shown to reproduce the queried cell state. That is the honest shape of the claim: the model proposes, the bench disposes.
What does this mean for patients today?
Less than the graphs suggest, and that gap should be stated plainly. Omics findings reach patients through long relays: a cell state implicated in disease becomes a target hypothesis, then a perturbation experiment, then a program with a molecule, then trials. Atlas-scale data shortens the early legs — better target nomination, better patient stratification for trial entry, better biomarkers for reading a trial out — but no omics dataset is itself a therapy. The right professional reading habit is to ask of every atlas result: in what population was it measured, against what reference, and what perturbation confirmed causality? Where the last answer is missing, the result is a map coordinate, not a destination.
Which omics layers are read most often, and for what?
A practical hierarchy. Transcriptomics at single-cell resolution is the workhorse for discovery — cell-type enumeration, state annotation, perturbation signatures — because throughput per dollar leads the other layers by a wide margin. Genomics supplies the fixed variation: germline risk, somatic mutations, structural changes that define clonal populations. Proteomics and metabolomics read the operational layer closer to phenotype and to druggable enzymes, at lower throughput and with harder quantitation. Spatial methods, which preserve tissue geography while profiling, close the loop between molecular state and anatomical context — a cell's neighbors are often the missing variable in why a state exists at all.
The layers combine more often than they compete. A typical translational paper now sequences single cells, anchors them in a spatial map, and checks the headline states against proteomic or functional assays; the omics layer that leads the paper is the one the question demands, and a reader should be able to name that demand in one sentence before trusting the figure.
How should a reader evaluate an omics claim?
By four checks, in order. Sample and population: how many donors, which tissues, what disease stage. Reference and batch: against which reference the states were annotated, and whether the comparison crossed studies or instruments. Perturbation: whether any causal claim rests on an experiment rather than a correlation between profiles. Translation path: whether the claimed clinical relevance names a decision a program or trial could act on. Most published single-cell findings clear the first two checks and stop, and company claims built on omics should be asked how many nominated targets survived perturbation testing — a number sponsors can always state and rarely do.
A closing note on scale claims: cell counts are the field's most quoted and least informative figure. A 23.4-million-cell reference is a measurement of effort, not of truth; what matters is donor diversity, tissue coverage, and annotation quality across that corpus. The atlas programs themselves report these dimensions alongside the totals, and the professional habit of reading them together keeps the numbers honest.
This article explains research methods for professional readers. It is not medical advice and does not address any individual's condition or care.